

High Hopes: Q3 2023 Market Commentary
The Cambridge Dictionary describes the term “cat on a hot tin roof” as someone who is in a state of extreme nervous worry. We think that term accurately describes investors as we round third base in the 2023 investing year. Since our last quarterly letter, U.S. consumers have been on edge about things like a 40% increase in oil prices since mid-June, mortgage rates moving to new 40-year highs, persistently high inflation, predictions of an impending recession, a dysfunctional federal government, national debt that now exceeds 120% of the country’s Gross Domestic Product (“GDP”), and not least of all, 3rd quarter performance of the S&P 500 was down 3.3% after an increase of 16.3% in the first half of the year. The pleasantly surprising returns through June 2023 have now moved to the rearview mirror and the view through the windshield is worrisome. As we write this letter, Israel is in a state of war with Hamas in the Gaza Strip giving investors yet another reason to be nervous and uncertain.
One of the foundational axioms of investing is there is always something to worry about and 2023 certainly has its share of worries. Investors can always find a good reason to sit on the sidelines but that can be a very expensive decision. In our opinion, now is not the time to throw in the towel. Sure, there are economic headwinds that may mute returns, but investing is a long game, and we believe you have to be invested to win. Sitting on the sideline is not a successful investing strategy. As worrisome as current circumstances are, there are reasons to be cautiously optimistic.
1. Valuations are reasonable.
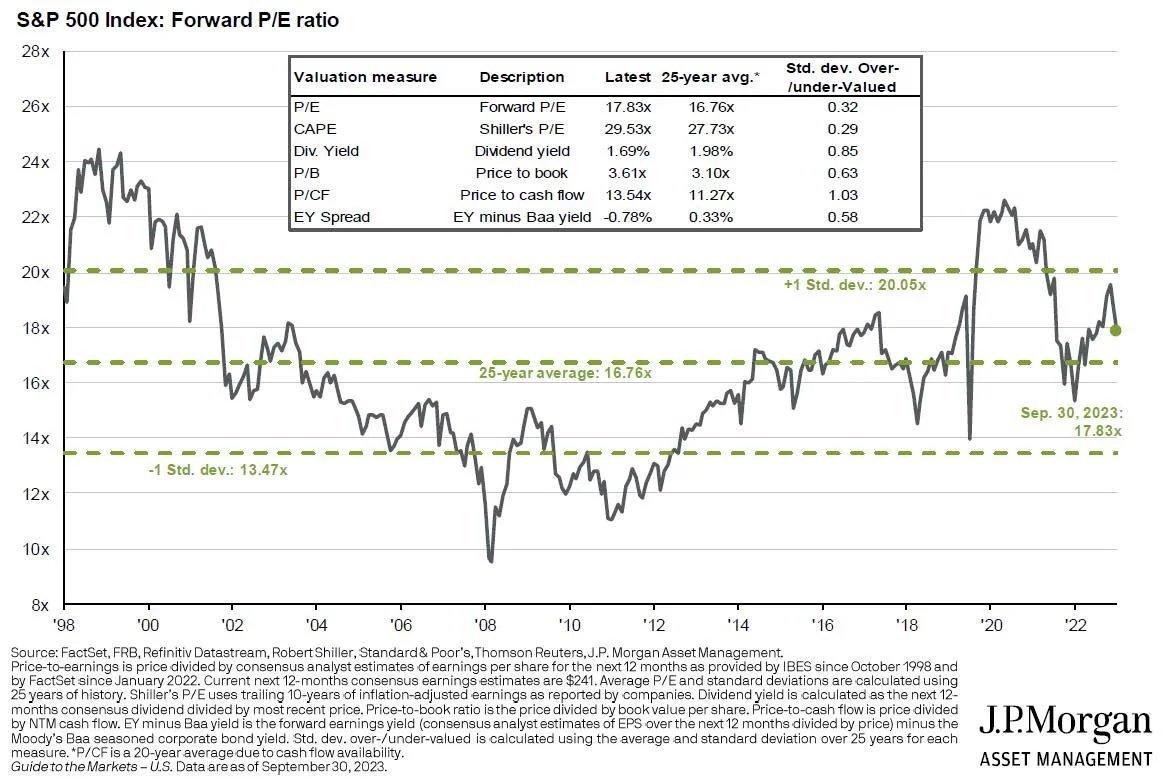
One of our favorite charts is the S&P 500 valuation measures chart shown on page 2. It helps us answer the question, “Are stocks cheap or expensive in the context of historical averages?” The black line tracks the ratio of price to earnings of the 500 largest publicly traded stocks in the United States over the last 25 years.
The green dotted lines provide context. The dotted line in the middle of the chart shows the 25-year average P/E ratio (16.76x). The dotted line at the top shows the point at which outcomes that fall above that line become “outliers” (statistically, one standard deviation above the mean, or 20.05x). The dotted line at the bottom shows the point at which outcomes falling below that line become “outliers” on the downside (statistically, one standard deviation below the mean, or 13.47x). Said another way, you would expect 65% of all outcomes to fall between the upper and lower dotted lines.
When the black line breaks above the top dotted line, we turn cautious. Another way to describe this condition…there is a greater probability of stocks going down than going up. Conversely, when the black line breaks below the bottom dotted line, we become more aggressive because we believe the prices are attractive.
So, with all of that as background, what does the chart tell us today? In a nutshell, it tells us stocks are “fairly valued.” The current P/E ratio is slightly above its 25-year average but not so much as to cause alarm.
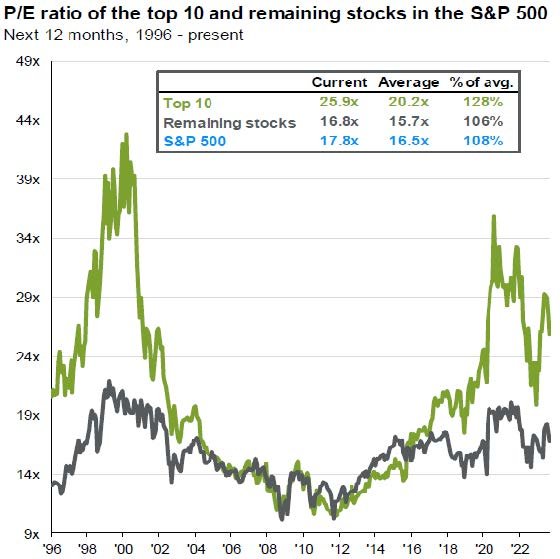
If you read last quarter’s letter, you will recall a discussion about the “magnificent 7.” Those seven large companies¹ were largely responsible for the first half returns in 2023. They also represent a very large percentage of the total value of the S&P 500. That prompts the question, how would the market valuation look if you removed those 7 large companies from the data. The chart below answers that question. The green line represents the P/E ratio of the 10 largest companies in the S&P 500. As of 9/30/2023 the P/E ratio of those 10 stocks was 25.9x and the P/E ratio of the remaining 490 stocks in the index is 16.8x which is only about 6% higher than the average P/E ratio during the period 1996 to present. The point we are making is the broad market valuation is skewed by the largest 10 companies in the index and we feel there are plenty of attractively priced stocks among the remaining 490 companies (not to mention those who are not members of the S&P 500 index).

2. Seasonal performance history supports a stronger 4th quarter.
Although we don’t subscribe to superstition or fate, the 3rd quarter and in particular, the month of September, have been statistically significant poor performers over the last 90 years. Since 1928 the third quarter has been the worst performing quarter of the S&P 500 index. The third quarter of 2023 continued that trend. On the flip side, the 4th quarter has been the best of the four quarters. However, as interesting as historical trends can be, the most important factors we consider are hard economic data, corporate earnings, and monetary policy.
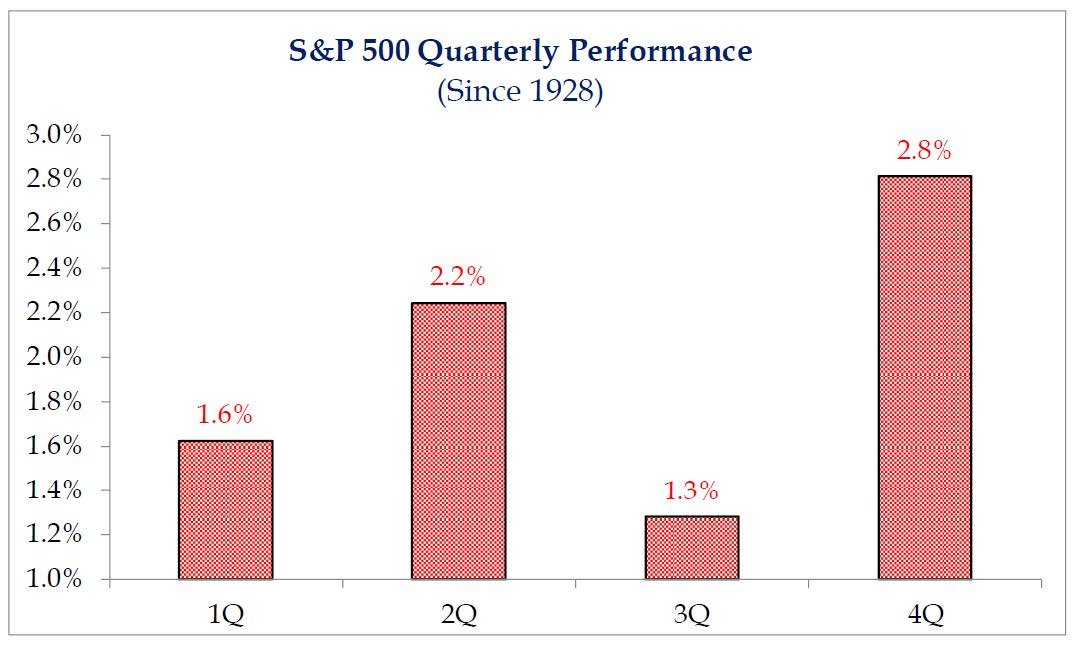
Source: www.strategasrp.com
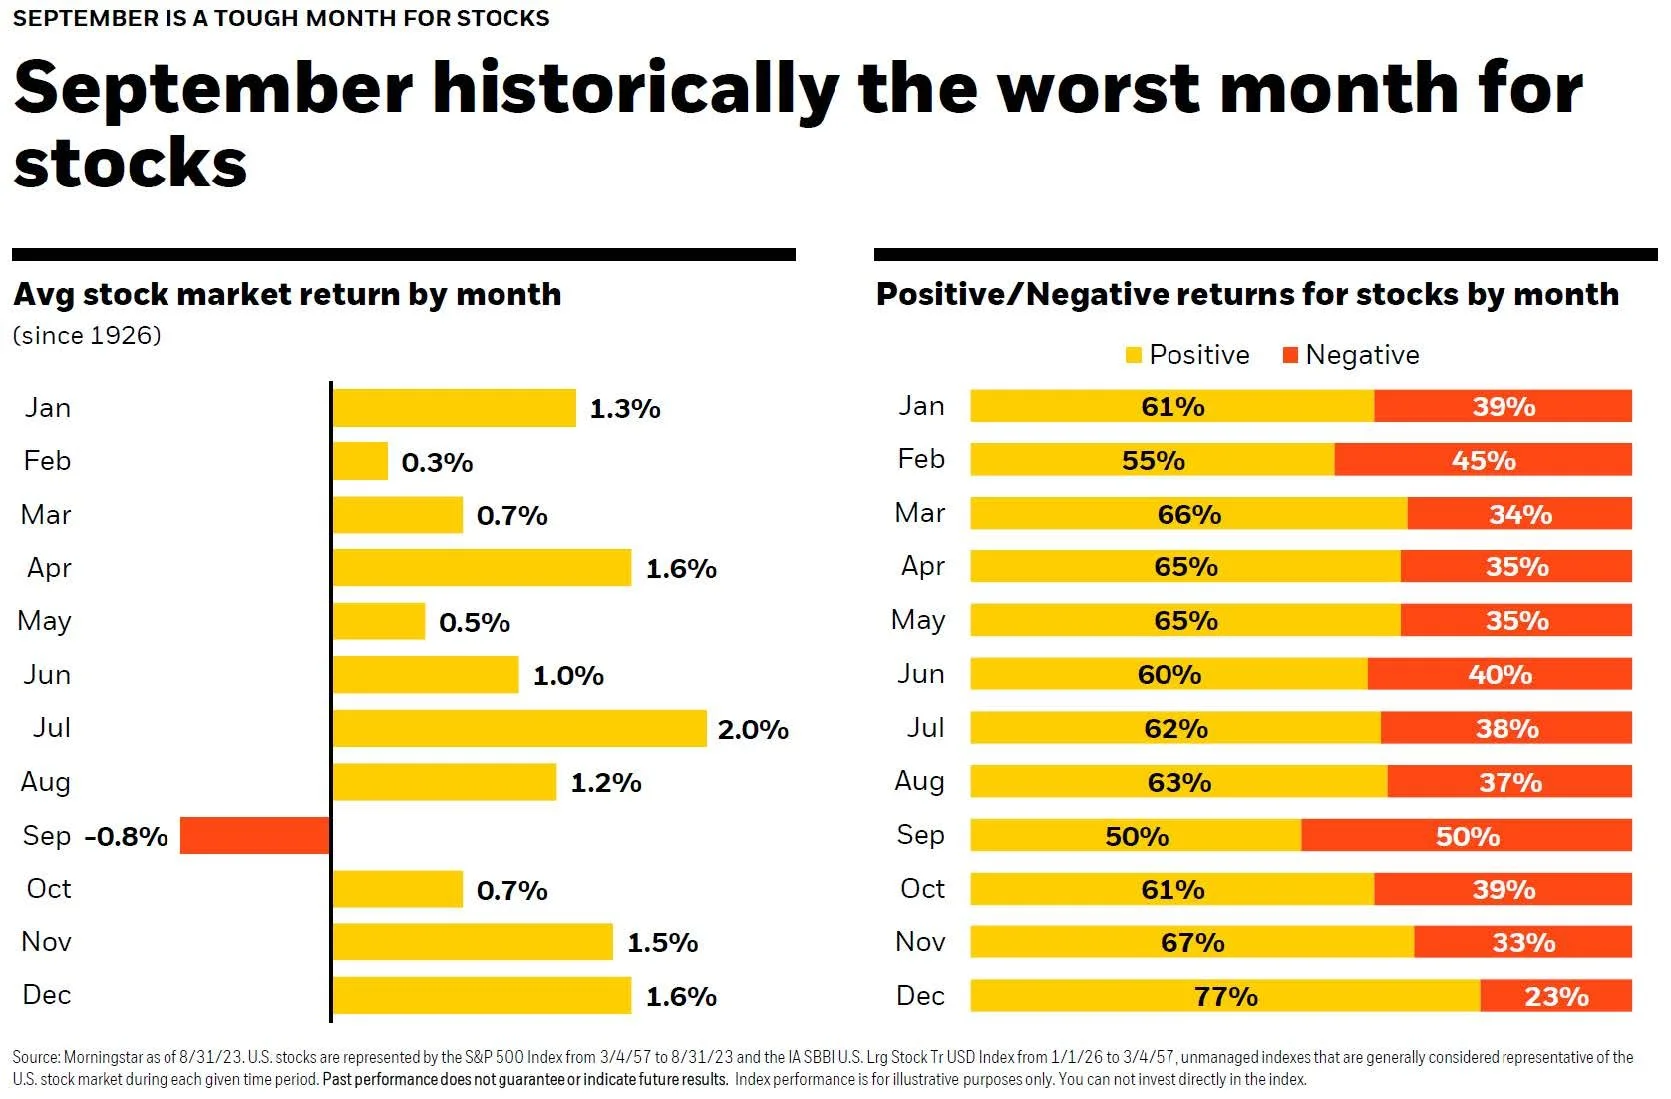
If we take a more granular look at the third quarter, September was the month that contributed to the negative performance while July and August actually contributed positive gains. The slide on the next page shows average monthly stock market returns by month. September is the only month that has averaged negative returns (going back 97 years to 1926) and September has produced a negative return in half the months during that period. No other month has a similar track record (see the chart on the following page).
There is an old saying that dates back to old England “Sell in May and go away.” It harkens back to when stockbrokers would go on summer vacation and not return until September. The theory was built on the belief that returns in the May to October period underperformed the rest of the year. The only problem with that theory… July has historically been the very best month of the year for stocks. May, June, and August have produced positive returns, on average since 1926. We don’t place much confidence is pithy sayings when it comes to investing.
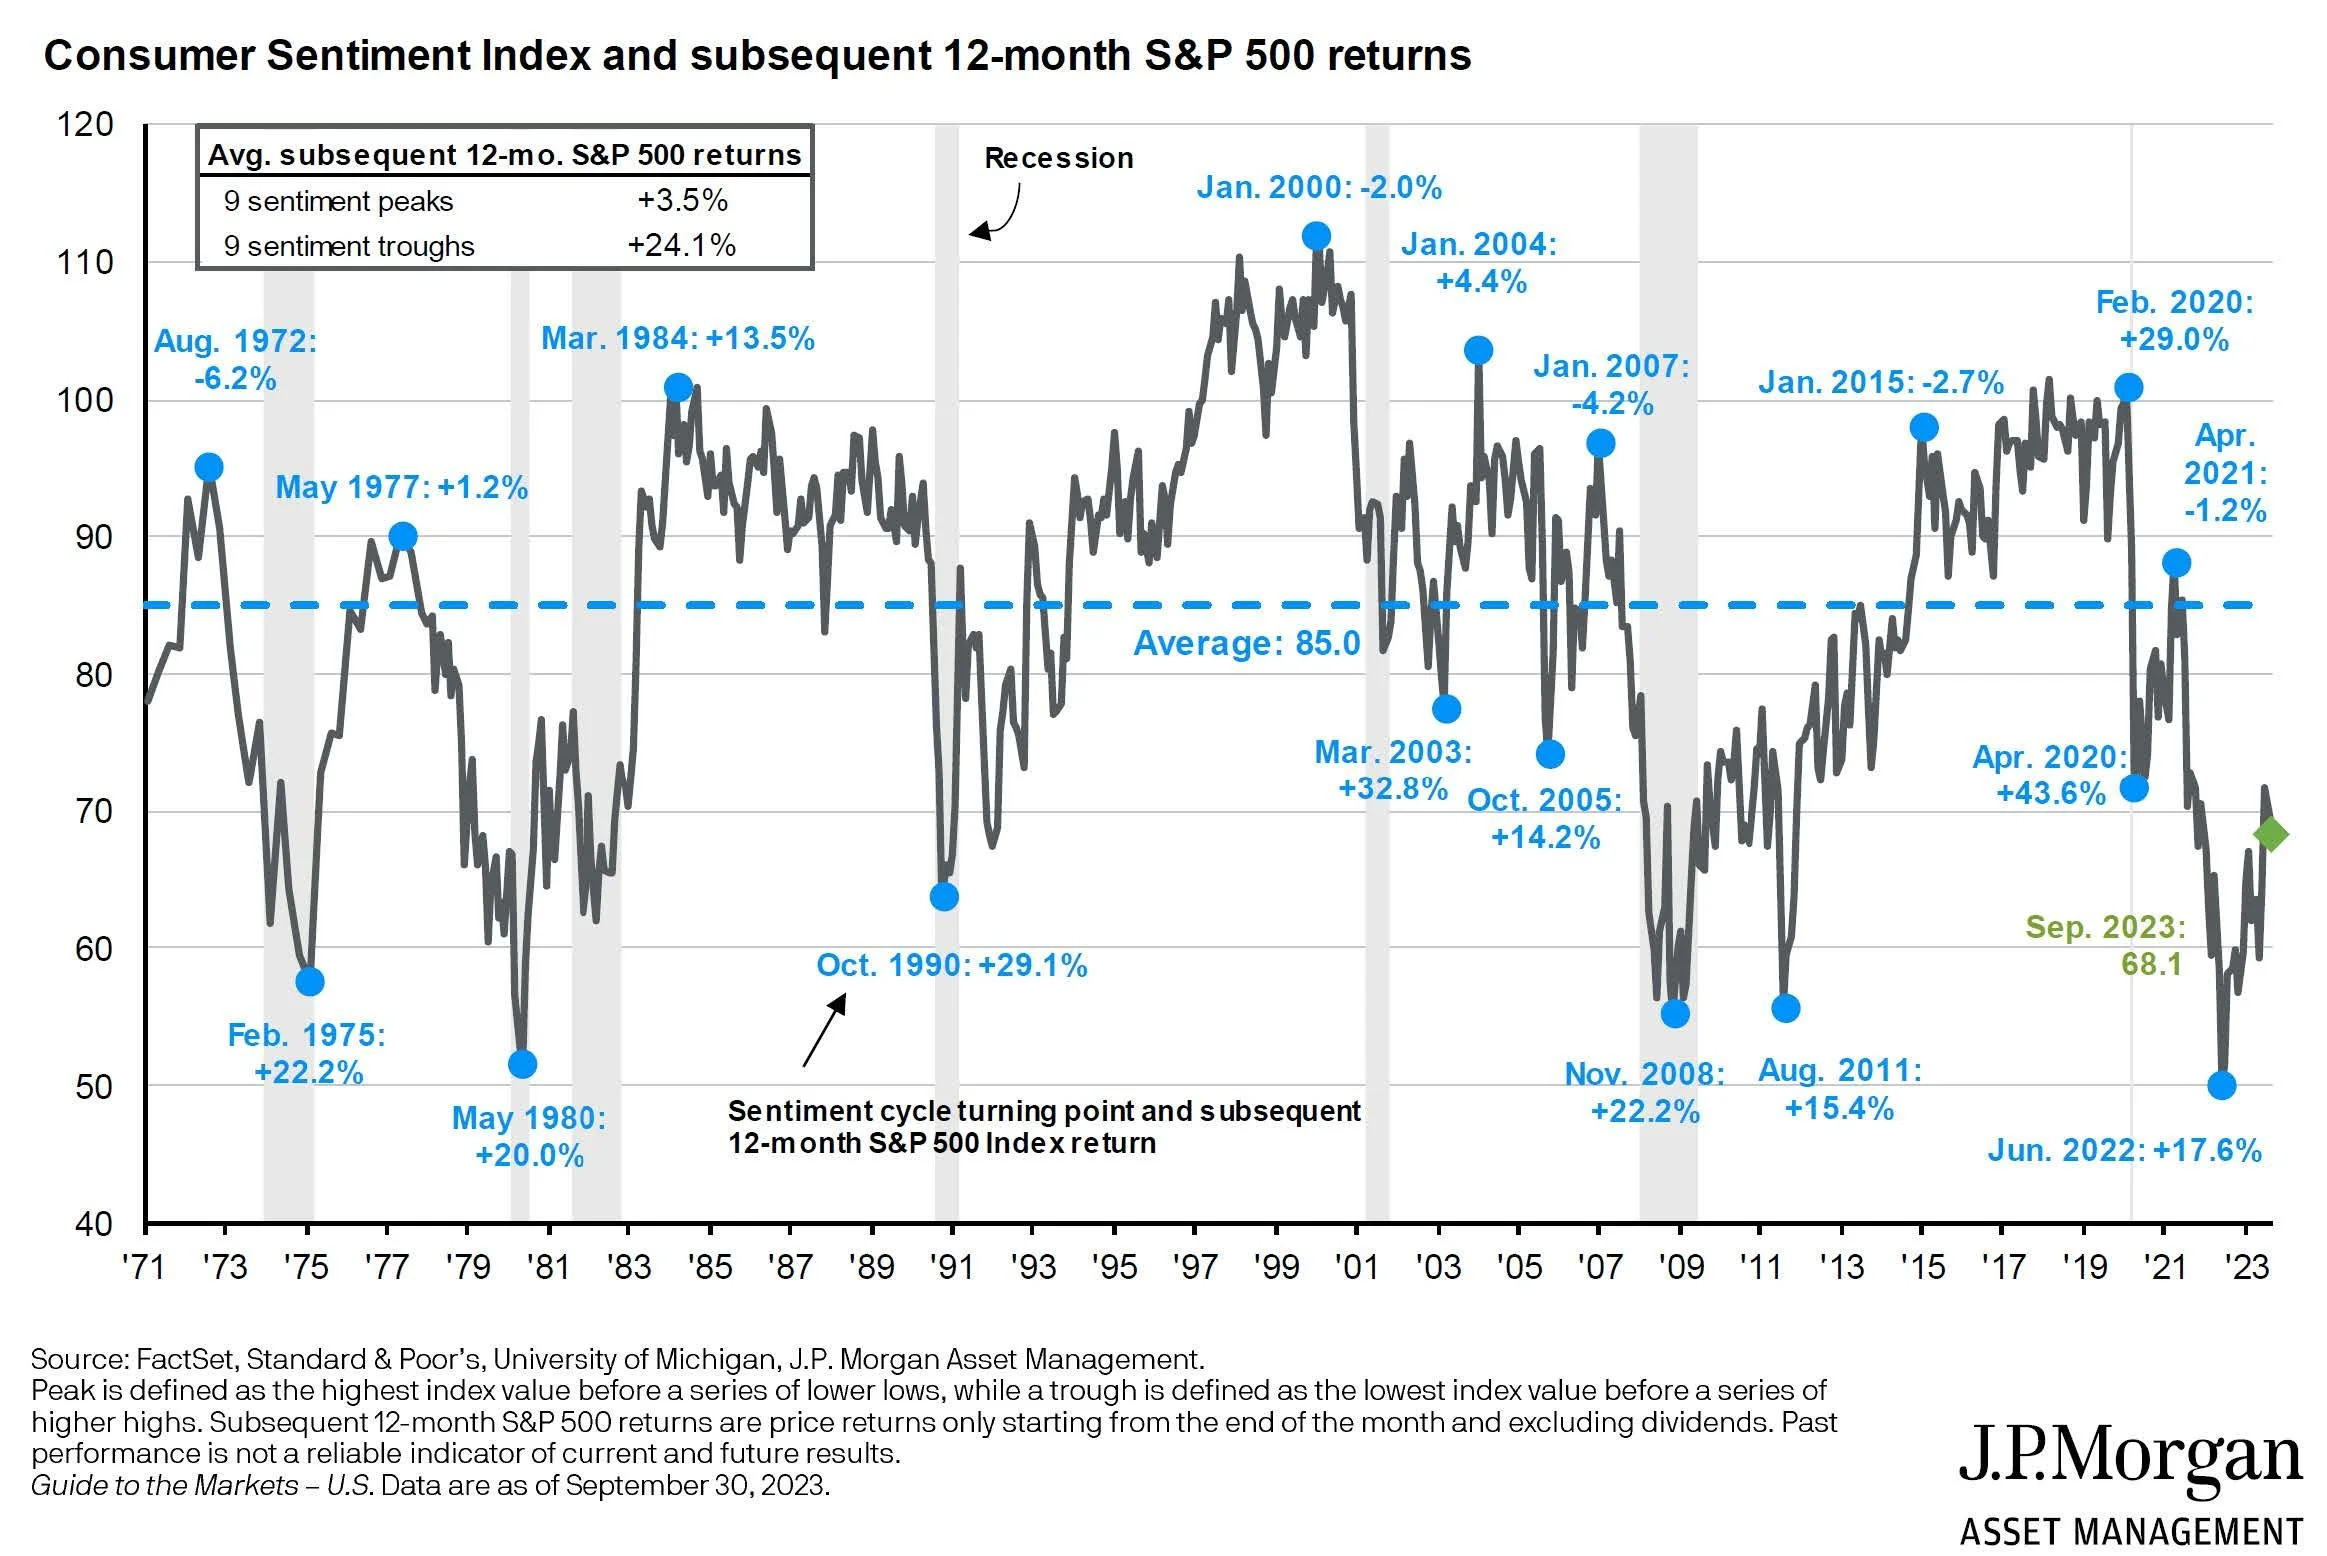
3. Past consumer sentiment troughs have been followed by attractive 12-month S&P 500 returns.
The chart that follows plots the University of Michigan’s consumer confidence index back to 1971. Over that time period the index has averaged 85 (the blue dotted line). There have been 9 troughs over that 53-year period and the 12 months return after a trough has averaged 24%.
The last trough was in June 2022. Since that trough the S&P 500 has returned 17.6% (6% less than the 53-year average). The index declined in September and now stands at 68.1. Is that another trough to be followed by attractive returns? We don’t know, but history tells us probabilities favor positive returns when the consumer sentiment index is below its average.
Is this enough to turn bullish on stocks and go on a buying spree? No, its just one metric to consider along with many others.
4. Long-term investing horizons stack the odds in your favor.
Imagine a new investor (let’s call him Mr. High Hopes) opens an investment account on December 31, 1926, with $1,000 and uses all of it to purchase a S&P 500 index fund (let’s pretend such an investment existed back then). He bought 74 units (let’s also assume his uncle is a stockbroker and made his initial trade for free). On January 31, 1927 (one month later) the value of his investment has dropped to $937.74, a decline of 6.6% and an annualized return of minus 73%! Over the next 11 months his investment claws back some of his losses but ends the year with a total value of $993.34. So, over his first 12 months as an investor, Mr. High Hopes has lost $6.66. He is discouraged.
1927 is a better year and Mr. High Hopes’ investment ends the year at a value of $1,299. Now Mr. Hopes is feeling better; he earned a return of 31% in 1927. 1928 is more of the same – a handsome return of 32% puts the value of his 74 units at $1,815. His bliss continues and on September 1, 1929, his investment is worth $2,320. In 44 months, he has seen his investment double from $1,000 to over $2,300. He has a compounded annual return of 23.2% - he’s very pleased.
In late September 1929 the market crashes and he loses 11% of his investment in the last two days of the month. In October he loses another 26% and on January 1, 1930, the total value of his investment is $1,609. He has held it for 4 years and his annualized return is 11.95%. Not bad. He was rewarded by remaining calm and staying invested even in the midst of the worst market performance in the last 90 years. Today, that fictional investment would be worth $318,829. Very few of us have 90-year investment horizons. However, we know from history that bear markets have always reversed themselves and moved to higher highs. It can be uncomfortable waiting, but patience has always been rewarded. The key is not putting yourself in the position that you must sell in the face of a big drawdown. Having staying power during times of volatility is key and we call that having a long investment horizon.
So, while the prognosticators such as Nouriel Roubini (also known as “Dr. Doom”) peddle fear and uncertainty, we like to take a more balanced outlook. Do the factors we have discussed above guarantee positive returns in the coming months? Of course, not. Nobody knows how markets will react and those that predict are often wrong.
In conclusion, let us say a few words about the tragic and senseless events in Israel over the last week. Our thoughts and prayers are with those in Israel who have lost loved ones and those who are enduring unspeakable atrocities as hostages. Our earnest hope is that peace will come to that troubled part of the world.
As we watch these events unfold, we naturally ask “What effect might these events have for investors?” That is a very difficult question to answer because events of this type typically play out over time and what seems obvious in the beginning can take unexpected turns. The Russian invasion of Ukraine in February 2022 is an example. Early conventional wisdom thought Russia would overtake and conquer the Ukraine in a matter of days. Now, 18 months later, that war has no clear path to victory for either side. Snap decisions based on first reports (or even second and third) are risky and taking a more measured approach feels more appropriate to us. However, here are some initial considerations:
Certainly, the first reaction of investors in times of war is to move to a “risk-off” posture. “Risk-off” means investors look to lower risk in their portfolios by selling positions that have higher risk (such as stocks) and moving to positions of lower risk such as U.S. government bonds, gold, or less volatile stocks. However, wars are generally inflationary and investment in government bonds or the U.S. dollar may not keep up.
Unlike the Arab Israeli War of 1973 that resulted in the Arab Oil Embargo, the United States in 2023 has vast resources of fossil fuels. The spike in energy costs in 1973 was a shock to the U.S. economy but so far, energy prices have been relatively stable in the aftermath of the Hamas attack.
Another difference between 2023 and 1973 may be the response of the Arab world. In 1973 the response was united among Arab countries but there is uncertainty that 2023 will follow suit.
The thawing of relations between Saudi Arabia and Israel is now likely delayed.
Initially, yields on treasury bonds may fall but if this conflict follows a similar path to others, 10-year treasury yields will eventually move higher. Of course, the Fed’s response will also impact yields.
Finally, for those who ask the question “What will you be doing to soften the effects of an uncertain economy and uncertain domestic and international politics?”; our answer is “We have already done it.” We lower the volatility (risk) of portfolios as we build them by focusing on companies that have successful track records of producing earnings and free cash flow. We also purchase stocks that are selling at a discount to what we believe is their long-term value. We favor fixed income investments that focus on return of principal rather than nominal yields. We diversify portfolios among asset classes, and we introduce “non-corelated” assets into portfolios. By non-corelated we mean investments that behave differently than equity investments. By pursuing these tactics on a continual basis, it reduces the need to “do something” when the investing climate suddenly changes. The problem with reacting to events in real time is that by the time you hear it on the news, its too late to make preemptive moves. Our approach is to pay attention to risk and build portfolios that can be resilient throughout the economic cycle.
As always, we want to thank you for choosing us as your financial advisor. We take that responsibility very seriously and are working every day to help you achieve you financial goals in the midst of an uncertain world.
Please call one of our locations if we can answer any questions.
Atlanta | Chattanooga | Macon
Best regards,

October 13, 2023
¹ The Magnificent 7 stocks are:
Meta Platforms (META) a/k/a Facebook
Nvidia (NVDA)
Amazon (AMZN)
Apple (AAPL)
Alphabet (GOOGL) a/k/a Google
Microsoft (MSFT)
Tesla (TSLA)